In this first post on The Data Wrangler I show how to visualise financial data from the Yahoo API using Data-Forge and Highstock. I also demonstrate how to apply a simple moving average to the price data.
First published on Code Project
Click here for live demo (running on a free Azure instance, pls be patient).
Contents
- Contents
- Introduction
- Getting the code
- Screenshot
- Highstock
- Pulling data from Yahoo
- Data-Forge
- Simple moving average
- Event handling and resize to fit
- Azure deployment
- Conclusion
- Resources
Introduction
This post accompanies and explains my demonstration of Highstock charts using data from Yahoo's financial API. It is aimed at developers interested in processing and visualisation of financial data. You should have at least a basic knowledge of JavaScript and jQuery. Most of the useful information you'll find by studying the accompanying example code, in this post I'll give a brief overview of the technology and how it fits together.
This post introduces the open-source Data-Forge library which is a prototype and a work in progress. I am the main developer of Data-Forge and I want to bring attention to it and elicit feedback.
I also want to promote Highstock and the Yahoo financial API. I have nothing to do with either of these, I am promoting them purely as an enthusiastic user. I have found them both to be mature and stable and extremely useful.
The associated example code shows how to use Data-Forge (and various plugins) in the browser. With small variations all the Data-Forge and Yahoo code works under Node.js as well. Highstock is made for the browser and doesn't work (at least not easily) under Node.js.
The live demo is deployed to Azure directly from the GitHub repo.
This example demonstrates the following:
- Asynchronous loading of OHLC data into a Highstock candlestick chart.
- A simple moving average (SMA) is generated and overlaid on the OHLC data.
- Trading volume is displayed below the main stock price chart.
- Variables can be edited (company, SMA period, time interval) and the chart is regenerated.
- The chart resizes to fit the web page.
Getting the code
Clone or fork the GitHub repo. You can also download an up-to-date zip of the code from GitHub.
To run the server locally you'll need to install Node.js. With NodeJS installed you can run the following commands:
cd highstock-yahoo-demo
npm install
cd client
bower install
cd ..
node index.js
You can now go to http://localhost:8080 in your browser to see it running.
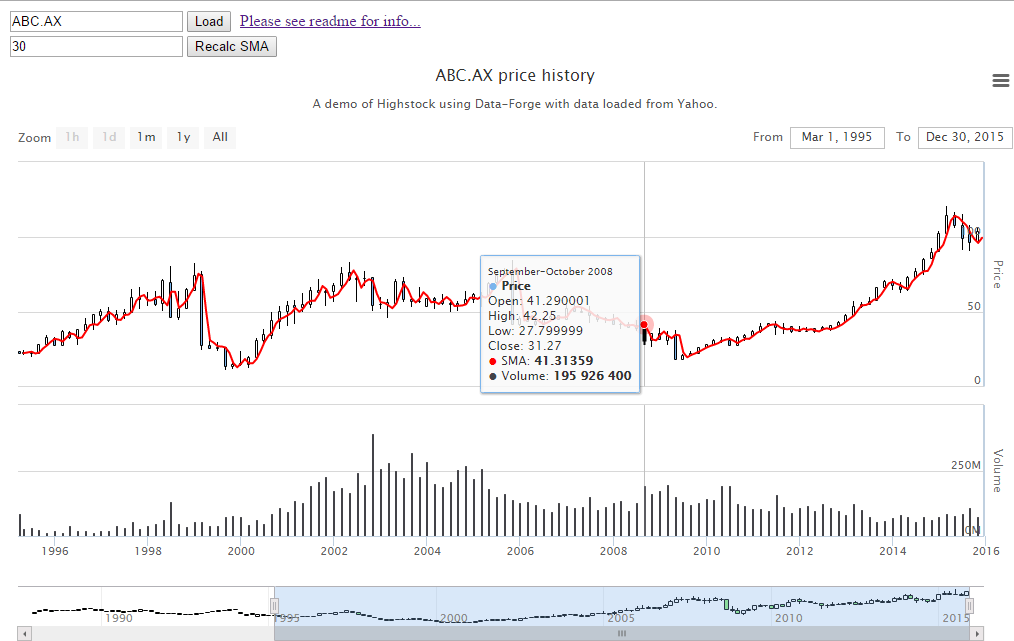
Screenshot
In case the live demo is down... here is a screenshot.
Highstock
Highstock is a pure Javascript, client-side stock charting library that is free for non-commercial use. The company behind Highstock, Highsoft, also have a general charting library called Highcharts. Highsoft have many commercial customers and their libraries are stable and mature.
For this example code I started with the Highstock async loading demo. I also incorporated elements of the candlestick and volume demo.
There are many other demos of Highstock that give a good understanding of its full capabilities. Highstock also has good docs and an API reference. Read these docs for a full understanding of Highstock.
The basic setup for Highstock is quite simple. Use jQuery to get the element that will contain the chart and call the highcharts function. Pass in the options to configure the chart and provide data:
var chartOptions = {
    // ... options that defined the chart ...
};

$('#container').highcharts('StockChart', chartOptions);
The chart options allow us to set the chart type, axis options and initial data.
Multiple data series can be stacked on top of each other. This is how the SMA is overlaid on the OHLC data. Multiple Y axis' can be stacked separately on top of each other, as is done in this example with the volume chart below the OHLC/SMA chart.
In the example code I use the chart types: candlestick, line and column. There are many more chart types available. The OHLC chart type is another you might be interested in that is relevant to financial data.
This example loads data asynchronously when the user zooms in on the data. Initially full data must be loaded so that Highstock has something to show in its navigator. The navigator allows the user to see the entire time series and zoom in on parts of it. It is very expensive to download full daily financial data for any company, therefore initially only monthly data is downloaded. Then as the user zooms in for a closer look weekly or daily data is downloaded as needed. This helps keep our data load minimal and our load time responsive.
Highcharts supports asyncronous data download via the afterSetExtremes event. You can also see a fairly simple example of this in the Highstock async loading demo. It looks something like this:
//
// Function called when the user changes the zoom level of the chart.
//
var afterSetExtremes = function (event) {
    var fromDate = new Date(event.min);
    var toDate = new Date(event.max);

    // ... load new data in the requested date range ...
};

var chartOptions = {

    // ...

    xAxis: {
        events: {
            // Wire up the event handler.
            afterSetExtremes: afterSetExtremes,
        },

        // ...
    },

    // ...
};
Pulling data from Yahoo
The Yahoo financial REST API is fantastic and possibly the only free financial API. It is a ready source of share market data. Unfortunately it can be difficult to get started as there seems to be little documentation besides community-contributed content.
The basic URL structure looks like this:
http://ichart.yahoo.com/table.csv?s=<company-code>For example you can pull full data (served in CSV format) for Microsoft with this URL: http://ichart.yahoo.com/table.csv?s=MSFT (click and see).
The downloaded CSV file can be viewed in a text editor or Excel (or something similar).
The URL can also have a interval parameter:
http://ichart.yahoo.com/table.csv?s=<company-code>&g=<interval-code>Valid interval codes are:
- d for daily;
- w weekly; and
- m for monthly.
For example to retrieve Microsoft data with a monthly interval: http://ichart.yahoo.com/table.csv?s=MSFT&g=m
The URL can also have parameter that specifies a date range that constrains the returned data to a particular period of time:
http://ichart.yahoo.com/table.csv?s=<company-code>&a=<from-month>&b=<from-date>&c=<from-year>&d=<to-month>&e=<to-date>&f=<to-year>Note that Yahoo expects a zero-based month. This is the same as the JavaScript Date class.
For example to retrieve Microsoft data for the last few months of 2015: http://ichart.yahoo.com/table.csv?s=MSFT&a=9&b=1&c=2015&d=11&e=31&f=2015
Of course, the example code doesn't directly hit the Yahoo API. Data-Forge has a convenient plugin data-forge-from-yahoo to pull data from Yahoo. The fromYahoo function returns a promise that resolves to a data frame that contains the data returned from Yahoo, which looks like this:
var dataForge = require('data-forge');
dataForge.use(require('data-forge-from-yahoo'));

var options = {
    baseUrl: location.protocol + '//' + location.hostname + ':' + location.port + '/yahoo',
};

dataForge.fromYahoo('MSFT', options)
    .then(function (dataFrame) {
        console.log(dataFrame.take(5).toString());
    })
    .catch(function (err) {
        // ... error handling ...
    });
Output:
__index___  Date                                                            Open       High       Low        Close      Volume    Adj Close
----------  --------------------------------------------------------------  ---------  ---------  ---------  ---------  --------  ---------
0           Mon Jan 04 2016 00:00:00 GMT+1000 (E. Australia Standard Time)  54.32      54.799999  53.389999  54.799999  52843200  54.799999
1           Thu Dec 31 2015 00:00:00 GMT+1000 (E. Australia Standard Time)  56.040001  56.189999  55.419998  55.48      26529600  55.48
2           Wed Dec 30 2015 00:00:00 GMT+1000 (E. Australia Standard Time)  56.470001  56.779999  56.290001  56.310001  21650300  56.310001
3           Tue Dec 29 2015 00:00:00 GMT+1000 (E. Australia Standard Time)  56.290001  56.849998  56.060001  56.549999  27489200  56.549999
4           Mon Dec 28 2015 00:00:00 GMT+1000 (E. Australia Standard Time)  55.349998  55.950001  54.98      55.950001  21698000  55.950001
The above code is meant to work under the browser. We can't hit the Yahoo directly due to cross-original resource sharing (CORS) restrictions, this is why we must use a proxy. As you can see baseURL is set to point to a proxy server. This same code will work under Node.js, but we won't need to set the baseURL, there is no CORS restriction so we can hit the Yahoo API directly from Node.js.
DIY Yahoo proxy
In the original version of this article I used a public CORS proxy to get around the CORS restriction. This didn't work very well. There were various problems such as the proxy not always being available.
So I built my own very simple proxy server. It actually has the dual purpose of serving the example web app and being a proxy to retrieve data from the Yahoo API.
This is a fairly simple Node.js application serving static pages with a simple REST API that is relayed to the Yahoo API:
var path = require('path');
var express = require('express');
var request = require('request-promise');
var E = require('linq');

var yahooBaseUrl = 'http://ichart.yahoo.com/table.csv';

var app = express();

// Serve static files.
var staticPath = path.join(__dirname, 'client');
console.log(staticPath);
app.use(express.static(staticPath));

// REST API that relays to the Yahoo API.
app.get('/yahoo', function (req, res) {

    var queryParams = E.from(Object.keys(req.query))
        .select(function (paramName) {
            return paramName + '=' + req.query[paramName];
        })
        .toArray()
        .join('&');

    var url = yahooBaseUrl + '?' + queryParams;
    request(url)
        .then(function (result) {
            res.set('Content-Type', 'text/csv');
            res.send(result).end();
        })
        .catch(function (e) {
            console.error(e)
        });
});

// Start the server.
var server = app.listen(process.env.PORT || 3000, function () {

    var host = server.address().address
    var port = server.address().port

    console.log('Example app listening at http://%s:%s', host, port)
});
Data-Forge
This example uses Data-Forge, an open-source data analysis and transformation toolkit for JavaScript that is inspired by Pandas and LINQ. Data-Forge is a work in progress and is at the prototype stage, so please use with care. I'm the main developer and keen to bring attention to it at this stage to elicit feedback and help solidify its direction.
You can install Data-Forge for the browser via bower:
bower install --save data-forgeOr for Node.js via npm:
npm install --save data-forgeThis example also has installed various plugins:
bower install --save data-forge-from-yahoo
bower install --save data-forge-to-highstock
Or
npm install --save data-forge-from-yahoo
npm install --save data-forge-to-highstock
To use Data-Forge in the browser you simply include the script files for Data-Forge and plugins in the HTML file:
<script src="bower_components/data-forge/data-forge.js"></script>
<script src="bower_components/data-forge-from-yahoo/from-yahoo.dist.js"></script>
<script src="bower_components/data-forge-to-highstock/to-highstock.dist.js"></script>
For Node.js require in the main module then use the plugins:
var dataForge = require('data-forge');
dataForge.use(require('data-forge-from-yahoo'));
dataForge.use(require('data-forge-to-highstock'));
Like a swiss-army knife, Data-Forge does many things, but what does data-forge do for us in this example?
Let's see...
- data-forge-from-yahoo wraps up pulling data from Yahoo and delivering us a data-frame.
- Data-Forge parses the CSV data returned from Yahoo and converts it to a data-frame.
- data-forge-to-highstock converts the data-frame to the format expected as by Highstock.
Simple moving average
A simple moving average (SMA) is computed and overlaid as a line chart on the OHLC chart. Simple moving average is a basic financial indicator that smooths the frequent fluctations in the share market to allow broader trends to be identified. This is very simple to achieve using the Data-Forge rollingWindow function:
var computeSmaSeries = function (series, period) {
    return series.rollingWindow(period)
        .asPairs()
        .select(function (pair) {
            var window = pair[1];
            return [window.getIndex().last(), window.average()];
        })
        .asValues();
};

var dataFrame = ...
var smaPeriod = 30;
var close = dataFrame.getSeries('Close');
var sma = computeSMASeries(close, smaPeriod);
var dataFrameWithSMA = dataFrame.withSeries('SMA', sma);

console.log(dataFrameWithSMA.toString());
Event handling and resize to fit
The example code relies on jQuery mostly for event handling. For example, basics like detecting button clicks and changes in input fields. In response to various events the Highstock chart is updated and re-rendered as necessary.
The most interesting event handler is for the window resize event. It would be great if we could handle an event for a particular HTML element (eg the container div for our chart). However this doesn't appear to be possible and we must handle resize for the entire window update the chart accordingly. This isn't the most flexible approach but it works when you want your chart to be sized according to the size of the window (or near enough). It is surprisingly difficult to figure out how to do this and it doesn't feel like the most elegant solution, however like so many other decisions in web development it often comes down to whatever works.
So we end up with a simple event handler for window resize:
$(window).resize(function() {
    resizeChart();
});
The resizeChart function updates the size of the Highstock chart:
var resizeChart = function () {
    var chart = $('#container').highcharts();
    chart.setSize($(window).width(), $(window).height()-50);
};
resizeChart is also called after chart creation to ensure that the chart is immediately set to the correct size. An unusual consequence of this is the that chart data is reloaded immediately after the initial data load (it doesn't happen when the chart's size is adjusted in the future). We don't want our data loading twice, that makes the app slower to load and kind of defeats the purpose of our optimized asynchronous loading. To counter this behaviour I modified resizeChart to set resizingChart to true while the resize is in progress:
var resizeChart = function () {
    try {
        resizingChart = true; // Track that we are resizing.
        var chart = $('#container').highcharts();
        chart.setSize($(window).width(), $(window).height()-50);
    }
    finally {
        // Finally clause ensures we never leave dangling state
        // should an exception be thrown.
        resizingChart = false;  // Finished resizing.
    }
};
Now we have resizingChart to test and subsequently abort data loading when the chart is being resized. Not the most elegant solution, but a good workaround for odd behaviour from Highstock.
UPDATE 19/01/2016
After recently realizing there was a rendering issue with the volume chart I contacted Highsoft for support. They got back to me very quickly with some suggestions, one of which worked so I've updated this article with the new information.
As mentioned above, I was calling resizeChart immediately after creating the chart to force it to adopt the size of the window. Something about this was causing the rendering issue. I had already figured out that the issue was something to do with resizing. Resizing the window (which updates the chart size) was causing the rendering issue to disappear.
Per Highsoft's recommendation I added code to set the size of the chart on creation, rather than sizing it after creation. This change was simple. Chart width and height are now specified in the chart options:
var chartOptions = {
    chart: {
        width: $(window).width(),
        height: $(window).height()-50
    },

    // ... all the other options ...
};
The chart's correct initial size is therefore set on creation and I was able to remove the subsequent call to resizeChart. Problem solved.
Note that resizeChart is still used to adjust the chart size after the window is resized, but it is no longer needed to set the chart's initial size.
Azure deployment
After moving from a public CORS proxy to my own proxy server I needed somewhere to host the live demo. I decide to deploy it as an Azure Web App, on the lowest tier that's basically free which is useful for this kind of demo.
While I was learning how to deploy a Node.js app to Azure I built two small examples. The first and simplest example demonstrates how to roll out the simplest possible web page to an Azure Web App. The second example shows how to deploy a simple Node.js app to Azure.
The github repo that hosts the code is setup to be directly deployed to Azure.
Conclusion
In this post I have introduced Data-Forge, an open-source data analysis and transformation toolkit.
In the example code I've demonstrated how to retrieve financial data from Yahoo and visualise it using Highstock. I've provided a brief overview of how the pieces fit together and shown how Data-Forge makes it all a bit simpler.
Resources
- Highstock demos: http://www.highcharts.com/stock/demo
- Highstock docs: http://www.highcharts.com/docs
- Highstock API reference: http://api.highcharts.com/highstock
- Data-Forge: https://github.com/data-forge/data-forge-js